Infogram - Great tool for making stunning graphs based on real data
 |
| Infogram Infographic Example |
Description: Infogram is a website where you can create various different charts to visually portray your data. Anything from bubble charts and treemaps to simple pie charts. You can either work with a built-in worksheet tool or import your data in an XLS, XLSX and CSV formats. You can download your infographic as a PNG or a PDF file and seamlessly share on various social media sites including Facebook, Twitter and Interest. So next time, when you are asked to present some data, test out Infogram and be ready to wow your boss, your teacher or your friends.
Pros: You can create graphs using real data, you can add your own images and video.
Cons: There is limited availability of other objects to be used in your infographics, such as people or buildings.
Link: infogr.am
Cost: FREE
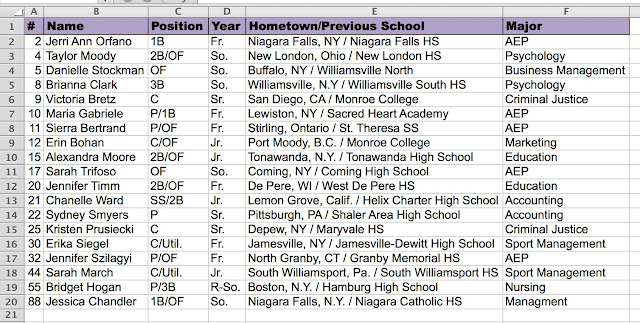
Experience: I was able to create the following infographic myself. The process was pretty intuitive and I would use it again, though I am pretty sure that one needs to sign up for the pro version to get the real benefit from using this service (for example, to download your infographic, you have to have this pro version). So for now, I am attaching a screen shot of what I created :-)

Disclaimer: Please note that all of the information provided above is accurate at the time of posting and works within the United States, though access to this tool may be limited in some other parts of the world.

Comments
Post a Comment